Diablillos is a 7,919 ha (79 km2) property located in the Argentine Puna region, which is the southern extension of the Altiplano of southern Peru, Bolivia, and northern Chile. It is a high plateau, separating the Cordillera Oriental to the east from the Andean Cordillera (Cordillera Occidental) to the west.
There are currently multiple near-surface deposits on the Diablillos property, including Oculto, JAC, Fantasma and Laderas. Diablillos is a high-sulphidation epithermal silver-gold deposit derived from remnant hot springs activity following Tertiary-age local magmatic and volcanic activity with strong supergene overprinting.
Updated Pre-Feasibility Study completed in December, 2024, with $747 Million After-Tax NPV and 28% IRR
Scroll right to view more
Scroll right to view more
Scroll right to view more
All dollar ($) figures are presented in US dollars unless otherwise stated. Base case metal prices used in the PFS are $2,050 per gold (“Au”) ounce (“oz”) and $25.50 per silver (“Ag”) oz.
PFS Study Highlights:
Attractive project economics: $747 million after-tax Net Present Value discounted at 5% per annum (“NPV5%”); 27.6% Internal Rate of Return (“IRR”) and 2.0-year payback period.
At current spot prices1 an after-tax NPV5% of $1,291 million with an IRR of 39.3% and payback of 1.5 years.
Substantial silver and gold production – 13.4 Moz silver-equivalent (“AgEq”) average annual production over a 14-year life-of-mine (“LOM”), comprised of 7.6 Moz Ag and 72 koz Au, with average annual production of 16.4 Moz AgEq over the first five years of full mine production, comprised of 11.7 Moz Ag and 59 koz Au.
Low All-in Sustaining Cash Costs (“AISC”)2– Average AISC of $12.67/oz AgEq over LOM, and $11.23/oz AgEq over the first five years of full mine production.
Initial capital expenditures - Initial pre-production capital expenditure of $544 million (including contingency) with a further $77 million in sustaining capital over the LOM.
Significant potential for additional economic improvements – Several additional opportunities that may further enhance the economic returns as detailed later in this release:
Replacement of on-site self-generation from a combined solar-diesel power plant with a connection to the national grid under a long-term power purchase agreement from a third party. Capturing this opportunity would provide a meaningful reduction to initial capital, lower operating costs and, potentially, improve the carbon footprint of the Project.
A revised mine plan based on a new Mineral Resource and Reserve estimate that incorporates the additional Phase IV exploration drilling results at JAC and the northeast zone of Oculto as well as higher metal price assumptions. A new mine plan may present the opportunity to reduce strip ratio, and improve operating cashflow.
Expansion of available water resources to the Project to remove constraints on plant throughput resulting in increased metal production.
Treatment of marginal material currently classified as waste through secondary processing, such as heap leaching, resulting in increased metal production.
Improvements to the design of the Tailings Storage Facility (“TSF”) to reduce capital and operating cost, and also decrease the environmental footprint.
Project Economics
Table 1 – Commodity Price Sensitivity Analysis
Economic Parameters
Base Case Prices
Spot Prices1
Down-Side Prices
Silver Price ($/oz)
$25.50
$30.70
$23.50
Gold Price ($/oz)
$2,050
$2,651
$1,850
After-tax NPV (5%, USD$ / CAD$ million)
$747 / $1,046
$1,291 / $1,808
$552 / $772
After-tax NPV (8%, USD$ / CAD$ million)
$552 / $772
$994 / $1,392
$392 / $549
After-Tax IRR (%)
27.6%
39.3%
22.8%
Payback (years)
2.0
1.5
2.4
1Note: Spot Price as at close on November 29th, 2024, per https://www.lbma.org.uk/ USD:CAD F/X rate: 1.40
The PFS presents a range of metal pricing scenarios on an after-tax basis to evaluate the economics of both upside and downside price scenarios. The economics of Diablillos are very robust and offer significant leverage to both silver and gold prices, with an after-tax NPV5%of $1,291 Million and an IRR of 39.3% at current spot silver and gold prices (Table 1).
Production Summary
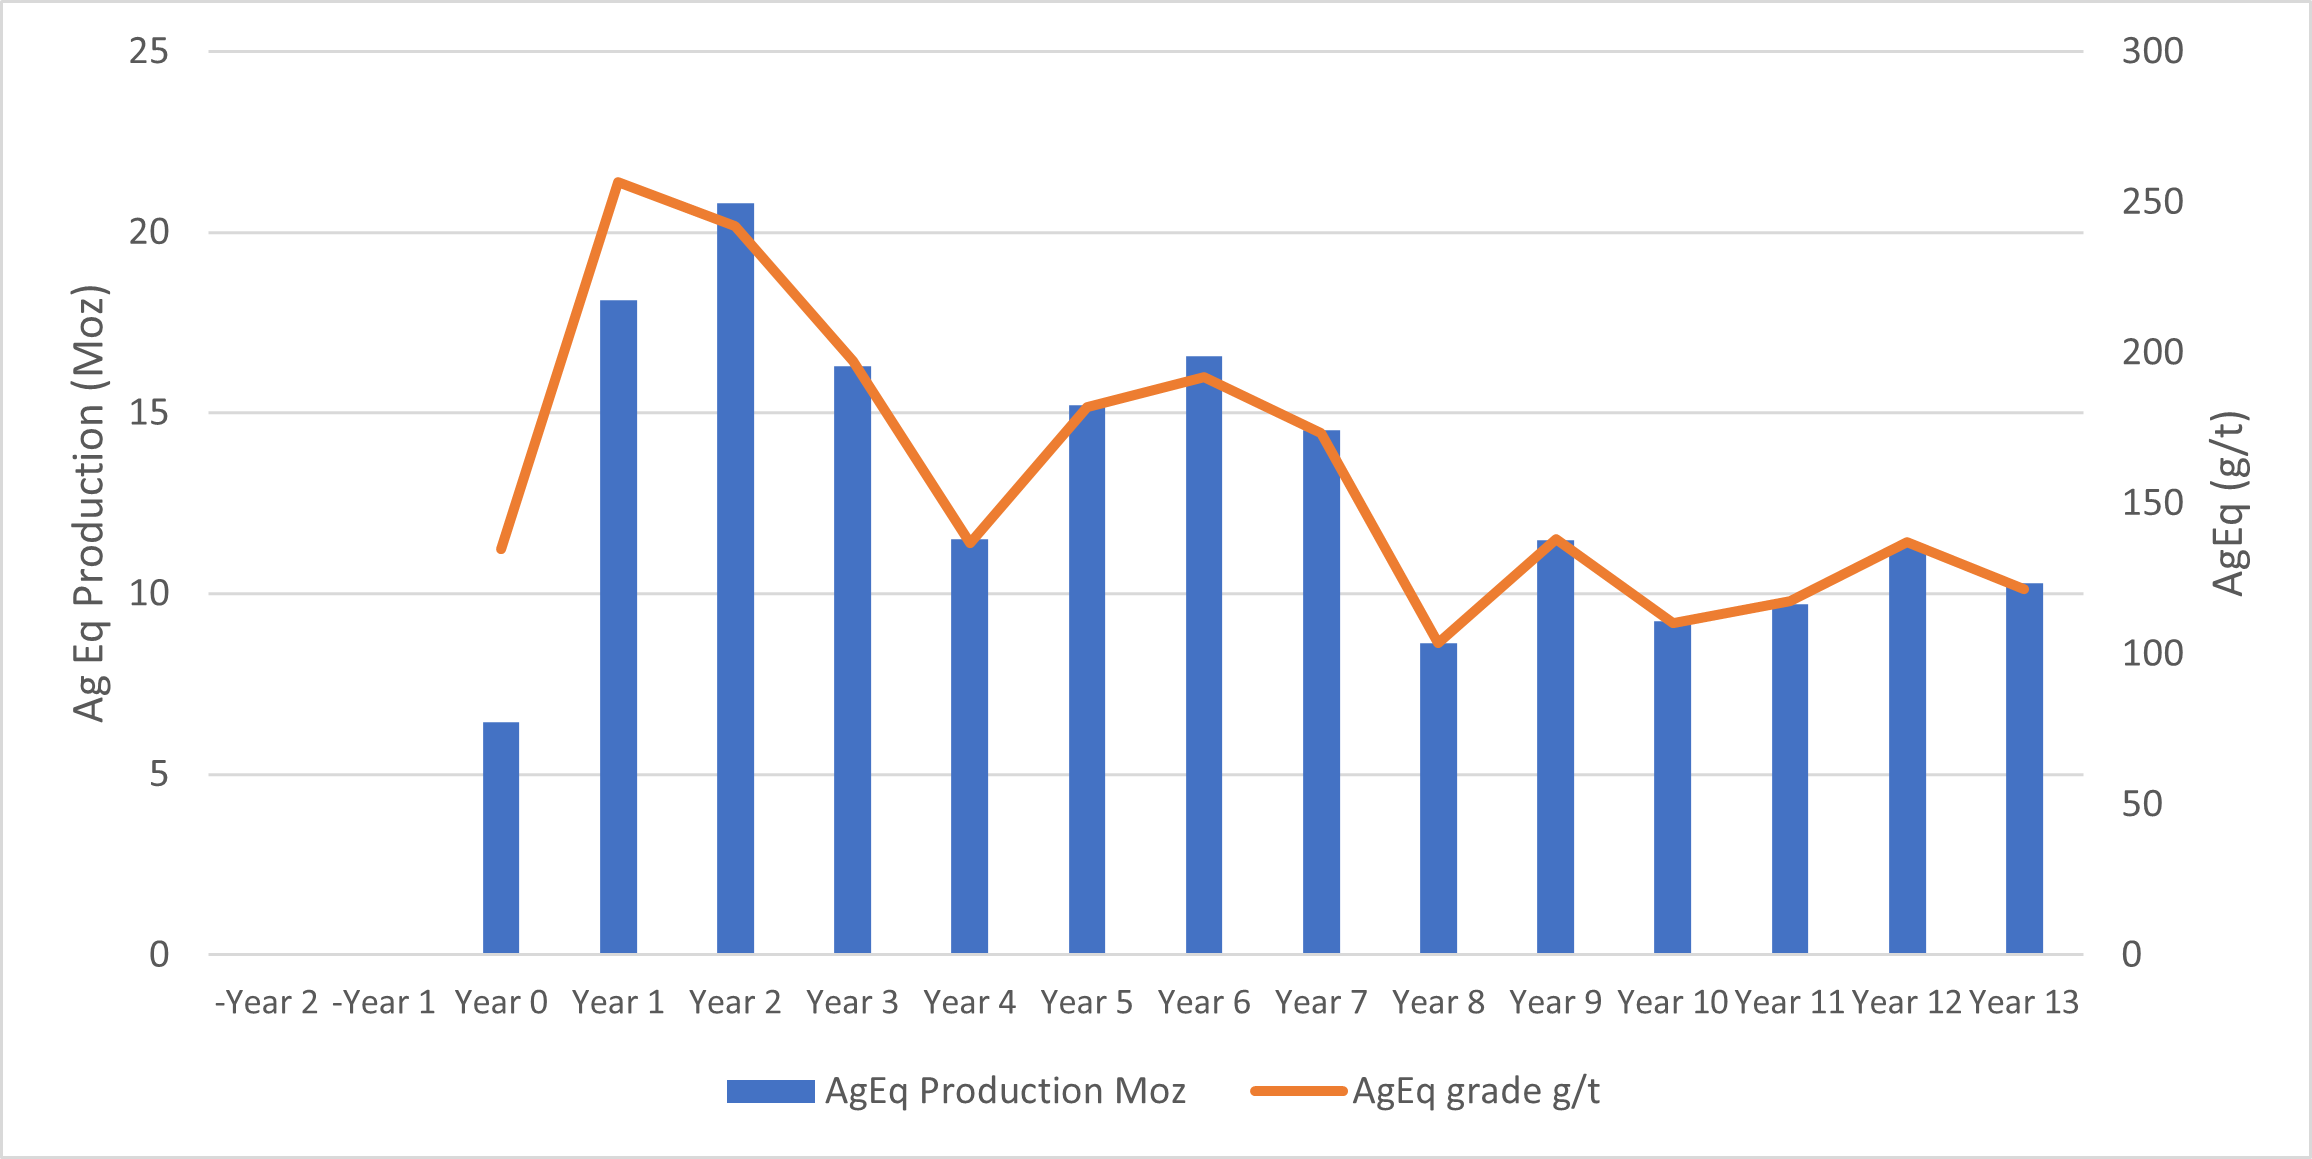
Diablillos is designed as a conventional open-pit mining operation with mill throughput of 9,000 tonnes per day (“tpd”) and an optimized production sequence targeting high-grade silver and gold mineralization in the early years of the mine plan. Over the 14-year mine life, the Project is expected to average annual production of 7.6 Moz silver and 72 koz gold, with an average of 11.7 Moz silver and 59 koz gold over the first five years of full mine production (Table 2 and Figure 1). The robust production profile in the initial years underlines the Project’s efficiency and strong cash-flow generation potential.
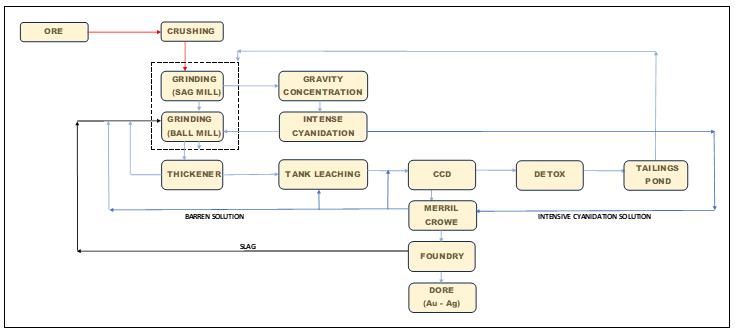
The processing plant has been designed for a nameplate capacity of 9,000 tpd, or 3.15 million tonnes per annum (“tpa”) considering 350 days a year of operation. A conventional silver/gold processing plant flowsheet was developed that incorporates crushing, grinding, gravity concentration, an intense cyanidation circuit, cyanide leaching with oxygen addition, counter current decantation washing thickeners and Merrill-Crowe precious metal recovery from solution followed by on-site smelting to doré bars. The leached solids are detoxified, thickened, and pumped to a TSF for permanent disposal.
Metallurgical test work has been carried out in a range of different laboratories between 1996 and 2023 and all the results have been considered as part of the PFS. A geo-metallurgical model has been developed segregating the deposit into five distinct domains, with overall LOM silver and gold recoveries averaging 83.6% and 86.8%, respectively.
Tailings from the process plant will be stored in a multi-phase, fully lined, cross valley TSF. The facility will be raised using the downstream method with the initial starter impoundment, constructed from borrow material and open pit pre-strip waste, providing storage for the first three years of production.
Table 2 – Grade and Production Profile
Units
Avg. First 5 Years Full Production
Avg. LOM (Year 1 – 14)
Silver Grades
(g/t)
143 g/t
91 g/t
Gold Grades
(g/t)
0.71 g/t
0.81 g/t
Silver-Equivalent Grades
(g/t)
201 g/t
159 g/t
Silver Production
(M oz)
11.7
7.6
Gold Production
(k oz)
59
72
AgEq Production
(M oz)
16.4
13.4
Note: AgEq is calculated using base case prices for silver and gold (Au/Ag price ratio of 80.39)
Figure 1 – Annual Silver Equivalent Production and Grade Profile
Operating Costs
The operating cost estimates are based on an owner-operated truck and shovel mining operation, conventional processing plant, and TSF with power provided from an on-site combined solar-diesel power plant.
The PFS operating cost estimates are shown on a per tonne milled basis in Table 3. The PFS estimates that the AISC averages $11.23/oz AgEq the first five years of production, and $12.67/oz AgEq over the LOM. This AISC is believed to be at the low end of the primary silver production cost curve2.
Table 3 – Mine Operating Cost Estimates
Operating Costs
Basis
Avg. LOM ($)
Mining (ore and waste)
per tonne milled
14.50
Processing Plant, Utilities and Maintenance
per tonne milled
22.71
Camp and Service Hub
per tonne milled
4.29
G&A and Logistics
per tonne milled
3.91
Total Operating Cost
per tonne milled
45.42
Project Capital Costs
The initial pre-production capital expenditures for the Project are summarized in Table 4. Capital expenditures to be incurred after the start-up of operations are assigned to sustaining capital and are projected to be covered by operating cash flows. Initial capital costs are estimated at $544 million including contingency and total sustaining capital costs are estimated at $77 million. Approximately 80% of the costs are based on quoted prices and this has resulted in a lower estimated contingency cost of $26 million. Over 60% of equipment, supplies, construction, and service procurement packages will be sourced from local companies, complying with local regulations.
Table 4 – Summary of Capital Cost Estimates
Description
Updated PFS Study
Prior PFS (Mar. 25, 2024)
Change
Updated PFS vs. Prior PFS
$ millions
$ millions
% Change
$ Change
Surface Mining
128.6
39.3
227%
89.3
Processing
111.7
96.9
15%
14.8
Site Infrastructure
166.7
152.0
10%
14.7
Owner and Indirect Costs
110.2
64.9
70%
45.3
Initial Capital Costs (excl. contingency)
517.2
353.2
46%
164
Contingency & Other Provisions
26.3
20.3
30%
6
Initial Capital Costs
543.5
373.5
46%
170
Sustaining Capital
76.5
65.0
18%
11.5
Closure
26.4
11.1
138%
15.3
Total Capital Costs
646.4
449.6
44%
196.8
Taxes and Royalties
The PFS incorporates the impact of Argentina’s recently enacted RIGI legislation designed to stimulate new large-scale investments. Under this framework, the Company expects a competitive fiscal regime, with key rates as follows:
Argentina corporate income tax: 25%
Municipal taxes: 1.2%
Stamp Tax 1.6%
Provincial mining royalty: 3%
Export duties: 0%
In total, the updated taxes, royalties and export duties total $536 million in the PFS, compared to $965 million under the Prior PFS. Additionally, the RIGI program provides benefits such as the removal of all foreign exchange restrictions, value-added tax (VAT) reimbursement on capital expenditures, and tax stability for the life of mine.
A 1% NSR royalty is payable to EMX Royalty Corporation.
Summary of Economic Results
Table 5 summarizes the key economic results and parameters of the PFS.
Table 5 – Summary of Project Economics
Metrics
Units
Results
Life of mine
years
14
Total mineralized material mined
M tonnes
42.3
Total contained silver
M oz
123.4
Total contained gold
k oz
1,108.2
Strip ratio (excludes pre-stripping)
Waste:ore
6.2
Throughput
tpd
9,000
Head grade – silver (first 5 years / LOM)
g/t
143 / 91
Head grade – gold (first 5 years / LOM)
g/t
0.71 / 0.81
Recoveries – silver (first 5 years / LOM)
%
83.5 / 83.6
Recoveries – gold (first 5 years / LOM)
%
85.2 / 86.8
Average Production – silver (first 5 years / LOM)
M oz
11.7 / 7.6
Average Production – gold (first 5 years / LOM)
k oz
58.7 / 71.9
AISC (LOM) – silver equivalent (first 5 years / LOM)
$/oz AgEq
11.23 / 12.67
Initial Capital Costs (including contingency)
$ M
544
Sustaining Capital Costs
$ M
77
Pre-Tax NPV5%
$ M
1,114
After-Tax NPV5%
$ M
747
Mineral Reserve Estimate – As of March 07, 2024
The Table below shows the Proven and Probable Mineral Reserves at Diablillos by deposit. The Mineral Reserves were estimated using a silver price of $22.50/oz and a gold price of $1,750/oz.
Diablillos Mineral Reserve Estimate
Mineral Reserve (all domains)
Tonnage (000 t)
Au (g/t)
Ag (g/t)
AgEq (g/t)
Contained Ag (koz)
Contained Au (koz)
Contained AgEq (koz)
Proven
12,364
0.86
177.7
246
46,796
341
97,839
Probable
29,930
0.80
79.7
143
76,684
766
136,267
Total Proven and Probable
42,294
0.81
90.8
154
123,480
1,107
209,619
Notes for Mineral Reserve Estimate:
Mineral reserves have an effective date of March 07, 2024.
The Qualified Person for the Mineral Reserve Estimate is Mr. Miguel Fuentealba, P.Eng.
The mineral reserves were estimated using the Canadian Institute of Mining, Metallurgy and Petroleum (CIM), Definition Standards for Mineral Resources and Reserves, as prepared by the CIM Standing Committee on Reserve Definitions and adopted by CIM Council.
The mineral reserves were based on a pit design which in turn aligned with an ultimate pit shell selected from a WhittleTM pit optimization exercise. Key inputs for that process are:
Metal prices of U$S 1,750/oz Au; U$S 22.50/oz Ag
Variable Mining cost by bench and material type. Average costs are U$S 1.94/t for all lithologies except for “cover” Cover mining cost of U$U 1.73/t, respectively.
Processing costs for all zone, U$S 22.97/t.
Infrastructure and G&A cost of U$S 3.32/t.
Pit average slope angles varying from 37° to 60°
The average recovery is estimated to be 82.6% for silver and 86.5% for gold.
The Mineral Reserve Estimate has been categorized in accordance with the CIM Definition Standards (CIM, 2014).
A Net Value per block (“NVB”) cut-off was used to constrain the Mineral Reserve with the reserve pitshell. The NVB was based on "Benefits = Revenue-Cost" being positive, where, Revenue = [(Au Selling Price (US$/oz) - Au Selling Cost (US$/oz)) x (Au grade (g/t)/31.1035)) x Au Recovery (%)] + [(Ag Selling Price (US$/oz) - Ag Selling Cost (US$/oz)) x (Ag grade (g/t)/31.1035)) x Ag Recovery (%)] and Cost = Mining Cost (US$/t) + Process Cost (US$/t) + Transport Cost (US$/t) + G&A Cost (US$/t) + [Royalty Cost (%) x Revenue]. The NVB method resulted in an average equivalent cut-off grade of approximately 46g/t AgEq.
In-situ bulk density was read from the block model, assigned previously to each model domain during the process of mineral resource estimation, according to samples averages of each lithology domain, separated by alteration zones and subset by oxidation.
All tonnages reported are dry metric tonnes and ounces of contained gold are troy ounces.
Mining recovery and dilution factors have not been applied to the Mineral Resource estimates.
Non-IFRS Financial Measures
This news release contains certain non-IFRS measures, including AISC. AISC includes operating costs, royalties, sustaining capital, closure costs, and corporate G&A and is calculated based on guidance provided by the World Gold Council (“WGC”). WGC is not a regulatory industry organization and does not have the authority to develop accounting standards for disclosure requirements. The Company believes that these measures, together with measures determined in accordance with IFRS, provide investors with an improved ability to evaluate the underlying performance of the Company and the results of the PFS. Non-IFRS measures do not have any standardized meaning prescribed under IFRS, and therefore they may not be comparable to similar measures employed by other companies. The data is intended to provide additional information and should not be considered in isolation or as a substitute for measures of performance prepared in accordance with IFRS.
1 Spot prices: $30.70/oz Ag & $2,651/oz Au closing prices on November 29th, 2024 (Source: https://www.lbma.org.uk/
Total Diablillos Mineral Resource Summary (Tank & Heap Leach) – As of July 21, 2025.
Zone
Category
Tonnes
(000 t)
Ag
(g/t)
Au
(g/t)
AgEq
(g/t)
Contained Ag
(000 Oz Ag)
Contained Au
(000 Oz Ag)
Contained AgEq
(000 Oz Ag)
Tank Leach
Oxides
Measured
26,545
119
0.71
183
101,564
604
156,487
Indicated
46,584
56
0.63
114
84,430
948
170,592
Measured &
73,129
79
0.66
139
185,994
1,553
327,078
Indicated
Inferred
9,693
34
0.57
86
10,616
176
26,647
Heap Leach
Oxides
Measured
6,673
16
0.14
25
3,486
30
5,342
Indicated
24,102
12
0.17
23
9,163
133
17,506
Measured &
30,774
13
0.16
23
12,649
162
22,848
Indicated
Inferred
10,024
9
0.20
21
2,811
64
6,850
Total
Oxides
Measured
33,218
98
0.59
152
105,050
634
161,829
Indicated
70,686
41
0.48
83
93,593
1,081
188,098
Measured &
103,904
59
0.51
105
198,643
1,715
349,927
Indicated
Inferred
19,628
21
0.38
53
13,427
241
33,496
Scroll right to view more
Refer to footnotes in Tables 2 and 4
Visualization of Oculto and JAC Mineral Resource Estimate
Diablillos Mineral Resource Estimate by Deposit (Tank Leach Material Only) – As of July 21, 2025.
Deposit
Zone
Category
Tonnes
(000 t)
Ag
(g/t)
Au
(g/t)
AgEq
(g/t)
Contained Ag
(000 Oz)
Contained Au
(000 Oz)
Contained AgEq
(000 Oz)
Oculto
Oxides
Measured
20,485
107
0.89
188
70,193
588
123,611
Indicated
36,898
45
0.77
115
53,128
917
136,439
Measured & Indicated
57,382
67
0.82
141
123,321
1,505
260,051
Inferred
8,026
27
0.67
88
6,898
173
22,663
JAC
Oxides
Measured
6,061
161
0.08
169
31,371
17
32,875
Indicated
7,073
119
0.05
124
27,121
11
28,090
Measured &
13,134
139
0.06
144
58,492
27
60,965
Indicated
Inferred
1,036
77
0.01
78
2,558
0
2,602
Fantasma
Oxides
Measured
-
-
-
-
-
-
-
Indicated
1,049
72
0.01
73
2,436
0
2,455
Measured & Indicated
1,049
72
0.01
73
2,436
0
2,455
Inferred
475
64
0.01
65
978
0
986
Laderas
Oxides
Measured
-
-
-
-
-
-
-
Indicated
806
17
0.67
78
428
17
2,014
Measured & Indicated
806
17
0.67
78
428
17
2,014
Inferred
104
15
0.68
77
51
2
259
Sombra
Oxides
Measured
-
-
-
-
-
-
-
Indicated
758
54
0.12
65
1,317
3
1,594
Measured & Indicated
758
54
0.12
65
1,317
3
1,594
Inferred
51
80
0.04
84
131
0
137
Total (tank leach)
Oxides
Measured
26,545
119
0.71
183
101,564
604
156,487
Indicated
46,584
56
0.63
114
84,430
948
170,592
Measured & Indicated
73,129
79
0.66
139
185,994
1,553
327,078
Inferred
9,693
34
0.57
79
10,616
176
26,647
Mineral Resources are not Mineral Reserves and have not demonstrated economic viability.
The formula for calculating AgEq is as follows: Silver Eq Oz = Silver Oz + Gold Oz x (Gold Price/Silver Price) x (Gold Recovery/Silver Recovery).
The Mineral Resource model was populated using Ordinary Kriging grade estimation within a three-dimensional block model and mineralized zones defined by wireframed solids, which are a combination of lithology and alteration domains. The 1m composite grades were capped where appropriate.
The Mineral Resource is reported inside a conceptual Whittle open pit shell derived using US$ 27.50/oz Ag price, US $2,400/oz Au price, 83% process recovery for Ag, and 87% process recovery for Au.
The constraining open pit optimization parameters used were US $1.94/t mining cost, US $22.96/t processing cost, US $3.32/t G&A cost, and average 51-degree open pit slopes.
The MRE has been categorized in accordance with the CIM Definition Standards (CIM, 2014).
A Net Value per block [NVB] calculation was used to constrain the Mineral Resource, determine the "Benefits = Income-Cost", where, Income = [(Au Selling Price (US$/oz) - Au Selling Cost (USD/Oz)) x (Au grade (g/t)/31.1035)) x Au Recovery (%)] + [(Ag Selling Price (US$/oz) - Ag Selling Cost (USD/Oz)) x (Ag grade (g/t)/31.1035)) x Ag Recovery (%)] and Cost = Mining Cost (US$/t) + Process Cost (US$/t) + Transport Cost (US$/t) + G&A Cost (US$/t) + [Royalty Cost (%) x Income]
The Mineral Resource is sub-horizontal with sub-vertical feeders and a reasonable prospect for eventual economic extraction by open pit and tank leach processing methods.
In-situ bulk density were assigned to each model domain, according to samples averages for each lithology domain, separated by alteration zones and subset by oxidation.
All tonnages reported are dry metric tonnes and ounces of contained gold are troy ounces.
Mining recovery and dilution factors have not been applied to the Mineral Resource estimates.
The Mineral Resource was estimated by Luis Rodrigo Peralta, B.Sc., FAusIMM CP (Geo), Independent Qualified Person under NI 43-101.
Mr. Peralta is not aware of any environmental, permitting, legal, title, taxation, socio-political, marketing, or other relevant issues that could materially affect the potential development of the Mineral Resource.
All figures are rounded to reflect the relative accuracy of the estimates. Minor discrepancies may occur due to rounding to appropriate significant figures.
Updated Tank Leach Mineral Resource Estimate Highlights Significant Growth at JAC and Oculto
The largest gains in the updated tank leach MRE stem from significant extensions at the JAC and Oculto deposits. These expansions underscore the high-grade continuity of mineralization at both deposits and their central role in supporting the upcoming mine plan. In total, the Diablillos project is now comprised of five deposits (Oculto, JAC, Fantasma, Laderas and Sombra) containing defined Mineral Resources.
At Oculto, M&I tonnage increased by 23%, with contained silver up 11% and gold up 14%. The growth is primarily driven by strong drill results from holes DDH-24-011, DDH-24-021, DDH-24-027, DDH-24-031, DDH-24-034, DDH-24-043, DDH-24-049, DDH-24-051, DDH-24-052, DDH-25-011 and DDH-25-024, which extended both the Silver Enrichment and Deep Gold zones to the northeast.
At JAC, M&I Mineral Resources increased by 148% in tonnage, with contained silver rising 70% and contained gold up 23%. This substantial increase reflects the success of the Phase IV drilling campaign, which focused on extending the orebody to the southwest and expanding the margins, further highlighting the potential of high-grade, near-surface silver mineralization in this area.
At Fantasma, M&I Mineral Resources grew by 54% in tonnage and 6% in contained silver. The increase in metal price assumptions has upgraded material previously classified as waste into lower grade mineralization, enhancing the size of the Mineral Resource in this area.
At Laderas, M&I tonnage rose by 74%, with contained silver up 79% and gold up 21%. As with Fantasma, higher metal price assumptions have led to the reclassification of material previously categorized as waste into lower grade silver and gold mineralization.
At Sombra, the initial M&I Mineral Resource is supported by 11 initial drill holes in this newly discovered area. Drill holes DDH-24-069, DDH-24-062, DDH-24-036, DDH-25-019 and DDH-25-026 confirm the potential of this zone. Although still at an early stage, Sombra shows significant potential as the mineralization lies beneath only 35 metres of easily mineable unconsolidated colluvial cover.
Comparison of the July 2025 M&I MRE (tank leach) to the Prior Estimate (November 2023).
Deposit
Category
Tonnes (000 t)
Ag (g/t)
Au (g/t)
Contained Ag (k oz Ag)
Contained Au (k oz Au)
Oculto
Current Resource
Measured & Indicated
57,382
67
0.82
123,321
1,505
Prior Resource
Measured & Indicated
46,824
74
0.88
111,401
1,325
Variance (%)
23%
-9%
-7%
11%
14%
Current Resource
Measured & Indicated
13,134
139
0.06
58,492
27
JAC
Prior Resource
Measured & Indicated
5,286
202
0.13
34,329
22
Variance (%)
148%
-31%
-54%
70%
23%
Fantasma
Current Resource
Measured & Indicated
1,049
72
-
2,436
-
Prior Resource
Measured & Indicated
683
105
-
2,306
-
Variance (%)
54%
-31%
-
6%
-
Laderas
Current Resource
Measured & Indicated
806
17
0.67
428
17
Prior Resource
Measured & Indicated
464
16
0.91
239
14
Variance (%)
74%
6%
-26%
79%
21%
Sombra
Current Resource
Measured & Indicated
758
54
0.12
1,317
3
Prior Resource
Measured & Indicated
-
-
-
-
-
Variance (%)
n/a
n/a
n/a
n/a
n/a
All deposits (tank leach only)
Current Resource
Measured & Indicated
73,129
79
0.66
185,994
1,553
Prior Resource
Measured & Indicated
53,257
87
0.79
148,275
1,360
Variance (%)
37%
-9%
-16%
25%
14%
Notes to Mineral Comparison Table
Key Assumptions in July 2025 MRE:
Ag price: $ 27.50/oz & Au price: $2,400/oz
Average recovery rates (tank leach): 82.6% Ag and 86.5% Au
Cut-off grade: based on Net Value per Block, with an average cut-off grade equivalent to ~39 g/t AgEq
For additional details, please refer to “NI 43-101 Technical Report, Mineral Resource Estimate, Diablillos Project” with an effective date of November 22, 2023 and available on the Company’s profile on www.sedarplus.ca.
Heap Leach Mineral Resource Estimate
The inclusion of a maiden heap leach Mineral Resource estimate marks an important milestone for Diablillos. This additional M&I tonnage of 30.8 Mt of lower-grade material is contained within the same constraining Whittle open pit as described above for the tank leach MRE. The vast majority of this tonnage, which is sourced from the Oculto deposit, was previously classified as waste and now provides the opportunity to reduce the strip ratio and further enhance overall Project economics. Preliminary metallurgical testwork has demonstrated that the heap leach material offers a potential incremental, cost-effective processing route that complements the primary tank leach circuit. A Preliminary Economic Assessment (“PEA”) evaluating the additional heap leach potential is planned for completion in H1 2026.
Diablillos Mineral Resource Estimate (Heap Leach Material Only) – As of July 21, 2025.
Deposit
Zone
Category
Tonnes
(000 t)
Ag
(g/t)
Au
(g/t)
AgEq
(g/t)
Contained Ag
(000 Oz Ag)
Contained Au
(000 Oz Ag)
Contained AgEq
(000 Oz Ag)
Total
Oxides
Measured
6,673
16
0.14
25
3,486
30
5,342
Indicated
24,102
12
0.17
23
9,163
133
17,506
Measured &
30,774
13
0.16
23
12,649
162
22,848
Indicated
Inferred
10,024
9
0.20
27
2,811
64
6,850
Notes for July 2025 MRE (Heap Leach Material):
Mineral Resources are not Mineral Reserves and have not demonstrated economic viability.
The formula for calculating AgEq is as follows: Silver Eq Oz = Silver Oz + Gold Oz x (Gold Price/Silver Price) x (Gold Recovery/Silver Recovery).
The Mineral Resource model was populated using Ordinary Kriging grade estimation within a three-dimensional block model and mineralized zones defined by wireframed solids, which are a combination of lithology and alteration domains. The 1m composite grades were capped where appropriate.
The Mineral Resource is reported inside a conceptual Whittle open pit shell derived using US$ 27.50/oz Ag price, US $2,400/oz Au price, 80% process recovery for Ag, and 58% process recovery for Au.
The constraining open pit optimization parameters used and overall operational cost of US $11.31/t.
The MRE has been categorized in accordance with the CIM Definition Standards (CIM, 2014).
A Net Value per block [NVB] calculation was used to constrain the Mineral Resource, determine the "Benefits = Income-Cost", where, Income = [(Au Selling Price (US$/oz) - Au Selling Cost (USD/Oz)) x (Au grade (g/t)/31.1035)) x Au Recovery (%)] + [(Ag Selling Price (US$/oz) - Ag Selling Cost (USD/Oz)) x (Ag grade (g/t)/31.1035)) x Ag Recovery (%)] and Cost = Mining Cost (US$/t) + Process Cost (US$/t) + Transport Cost (US$/t) + G&A Cost (US$/t) + [Royalty Cost (%) x Income]
In-situ bulk density were assigned to each model domain, according to samples averages for each lithology domain, separated by alteration zones and subset by oxidation.
All tonnages reported are dry metric tonnes and ounces of contained gold are troy ounces.
Mining recovery and dilution factors have not been applied to the Mineral Resource estimates.
The Mineral Resource was estimated by Mr. Peralta, B.Sc., FAusIMM CP (Geo), Independent Qualified Person under NI 43-101.
Mr. Peralta is not aware of any environmental, permitting, legal, title, taxation, socio-political, marketing, or other relevant issues that could materially affect the potential development of the Mineral Resource.
All figures are rounded to reflect the relative accuracy of the estimates. Minor discrepancies may occur due to rounding to appropriate significant figures.
Plan View of Mineral Resource Estimate
Mineral Resource Estimate Methodology
The tank leach open pit constrained MRE for Diablillos is based on a Net Value per Block methodology that results in an approximate cut-off grade of approximately 39 g/t AgEq, derived from assumptions regarding specified metal prices and estimated operating costs for mining, processing and G&A.
The updated processing assumptions now incorporate a secondary lower cost heap leaching metal recovery process for lower-grade material, complementing the primary tank leaching. The heap leach MRE has also employed a Net Value per Block method that results in a cut-off grade of approximately 22 g/t AgEq.
The updated MRE was prepared by Luis Rodrigo Peralta, B.Sc., FAusIMM CP (Geo), Independent Consultant, in accordance with Canadian Institute of Mining, Metallurgy and Petroleum (“CIM”) Definition Standards incorporated, by reference, and in compliance with National Instrument NI 43-101 - Standards of Disclosure for Mineral Projects (“NI 43-101”) and has been reviewed internally by AbraSilver.
The MRE incorporates approximately 157,211 metres of drilling from 733 drill holes (both historical and current).
The MRE is based on the Oculto, JAC, Fantasma, Laderas and Sombra deposits within the broader Diablillos property, reported within a constraining Whittle open pit shell. The cut-off grade was determined using a Net Value per Block calculation, factoring in the economic parameters outlined in the Supporting Technical Disclosure section below.
Gold and silver grades were estimated into the block model using RC and Diamond Drill Holes (DDH), including drilling completed up to March 30, 2025. Industry-standard estimation methodologies were applied, including Ordinary Kriging (OK) and validation against an Inverse Distance squared estimate (ID2). Drill hole intervals were composited to a length of 1 metre, which is the average sampling length for core sampling.
Grade capping was applied to composited grade intervals on a case-by-case basis for each estimation domain. Domains were defined by a combination of lithology, alteration, and oxide / sulphide state, resulting in a total of 24 estimation domains for gold and silver.
Supporting Technical Disclosure
Mineral Resources that are not Mineral Reserves do not have demonstrated economic viability.
The MRE incorporates geological and structural constraints and is constrained by an optimized Whittle open pit containing a total of 103.9 Mt of M&I Mineral Resources and 514 Mt of waste.
Individual metals are reported at 100% of in-situ grades.
The effective date of the MRE is July 21, 2025 and is based on drilling through March 30, 2025.
There are no known legal, political, environmental, or other risks that could materially affect the potential development of the Mineral Resource.
Key Assumptions are outlined below (all figures are in US dollars unless otherwise noted):
Commodity prices used were US$ 27.50/oz Ag price and US $2,400/oz Au price
Note: Commodity price assumptions were guided by the NI 43-101 requirement for the Mineral Resource to have 'reasonable prospects' of eventual economic extraction.
Metallurgical recoveries: tank leach metallurgical recoveries applied to the Mineral Resources were obtained from a geo-metallurgical model that has been built, based on metallurgical test works performed at SGS Canada. This model incorporates five domains applied into the block model, based on a master composite for each, based on 15 samples per domain approximately. A fixed value of metallurgical recovery has been applied to each domain. Overall average of these five domains are 87% for gold and 83% for silver, respectively.
Metallurgical recoveries: heap leach metallurgical recoveries were obtained from a preliminary bottle roll test work campaign on the lower grade mineralization. Recovery assumptions of 58% for gold and 80% for silver were used.
Operating cost estimations: mining costs of $1.94/t; tank leach processing costs of $22.96/t and G&A costs of $3.32/t. As for the heap leach an overall processing cost of $11.31/t respectively.
Open pit slopes: Open pit shell slope angles applied are based on 2022 geotechnical drilling and modelling. Six geotechnical sectors have been defined. The average overall angle assumed for open pit shell optimization was 51 degrees.
A Net Value per block [NVB] calculation was used to constrain the Mineral Resource, determine the "Benefits = Income-Cost", where, Income = [(Au Selling Price (US$/oz) - Au Selling Cost (USD/Oz)) x (Au grade (g/t)/31.1035)) x Au Recovery (%)] + [(Ag Selling Price (US$/oz) - Ag Selling Cost (USD/Oz)) x (Ag grade (g/t)/31.1035)) x Ag Recovery (%)] and Cost = Mining Cost (US$/t) + Process Cost (US$/t) + Transport Cost (US$/t) + G&A Cost (US$/t) + [Royalty Cost (%) x Income].
The formula for calculating AgEq is as follows: Silver Eq Oz = Silver Oz + Gold Oz x (Gold Price/Silver Price) x (Gold Recovery/Silver Recovery).
For additional information in respect of the Company’s drill results referenced herein, please refer to the Company’s news releases dated August 19, 2024, September 30, 2024, October 23, 2024, December 11, 2024, February 19, 2025, March 11, 2025, May 20, 2025 and July 15, 2025.
QA/QC and Core Sampling Protocols
AbraSilver applies industry standard exploration methodologies and techniques, and all drill core samples are collected under the supervision of the Company’s geologists in accordance with industry best practices. Drill core is transported from the drill platform to the logging facility where drill data is compared and verified with the core in the trays. Thereafter, it is logged, photographed, and split by diamond saw prior to being sampled. Samples are then bagged, and quality control materials are inserted at regular intervals at site; these include blanks and certified reference materials as well as duplicate core samples which are collected in order to assess sampling precision and reproducibility. Groups of samples are then placed in large bags which are sealed with numbered tags in order to maintain a chain-of-custody during the transport of the samples from the project site to the laboratory.
All samples are received by the ASA (Alex Stewart Argentina) preparation laboratory in Salta, where they are prepared, then the pulp sachet is directly dispatched to its facility in Mendoza, Argentina, where they are analyzed. All samples are analyzed using a multi-element technique consisting of a four-acid digestion followed by ICP/AES detection, and gold is analyzed by 50g Fire Assay with an AAS finish. Silver results greater than 100g/t are re-analyzed using four acid digestion with an ore grade AAS finish.
Qualified Persons and Technical Information
The site visit, review of various geological aspects including sampling techniques, drill core, logging, assay laboratory, secondary laboratory check samples and Mineral Resource estimate were done by Mr. Luis Rodrigo Peralta, B.Sc., FAusIMM CP (Geo). Mr. Peralta is an independent Qualified Person as defined by the NI 43-101. Mr. Peralta has reviewed and approved the technical content of this news release.
The full Technical Report in respect of the Mineral Resource estimate is being prepared in accordance with NI 43-101 and will be available on SEDAR+ (www.sedarplus.ca) under the Company’s issuer profile. The effective date of the Mineral Resource estimate is July 21, 2025.
Significant Exploration Upside Potential
There remains substantial potential to further expand the Diablillos Mineral Resource estimate within the existing deposits, particularly at Oculto East. Ongoing and planned drilling is aimed at both step-out exploration and defining new high-grade zones to extend the current Mineral Resources. The Company is advancing its fully-funded Phase V drill program, which includes an additional 20,000 metres of drilling scheduled for completion by early 2026.
Existing Deposits:
Oculto: Ongoing exploration is focused on extending known zones of mineralization, particularly towards the northeast, where Oculto East represents a key growth opportunity. Results from recently announced hole DDH 25-024, with 31m @ 9.96g/t Au and 16.2g/t Ag, show the very high-grade gold potential of the Oculto East area, and follow up drilling is underway with three rigs. Geological interpretation has identified several structures in the area with high-grade gold potential.
JAC: Upcoming drilling will test the margins of the conceptual constraining open pit where mineralization remains open.
Sombra: An initial Mineral Resource has now been established, and additional drilling is planned to expand this new discovery. The mineralized zone is very shallow, covered by unconsolidated colluvium, and is open along strike. Drilling was postponed here following the high-grade gold intercept at Oculto East, which became the priority exploration area.
Diablillos Porphyry Complex:
Cerro Viejo: The shallow intercept of 36.0m at 1.91 g/t gold in hole DDH 24-056 in the root zone of epithermal mineralization at Cerro Viejo is scheduled for follow-up drilling later this year. Mapping has shown that gold mineralized silicified zones extend significantly towards the west of hole DDH 24-056.
Cerro Blanco: This is the highest priority area for porphyry style mineralization based on shallow historical Reverse Circulation (“RC”) drill results and surface rock chip sampling of a mineralized breccia zone. The area has been mapped in detail and surface sampling completed in preparation for a deeper drilling program expected to commence before the end of August 2025.
Metallurgical Overview
The Diablillos project is expected to have a conventional silver/gold processing plant flowsheet incorporating crushing, grinding, gravity concentration and intense cyanidation circuit, cyanide leaching with oxygen addition, counter current decantation (“CCD”) washing thickeners and Merrill-Crowe precious metal recovery from solution followed by on-site smelting to doré bars. A summary of the processing flow sheet for the Diablillos project is shown below.
Recent Positive Metallurgical Test Results
Oculto Deposit
On October 10, 2023 the Company reported positive results from metallurgical optimization testing on the Oculto deposit. The metallurgical testing was conducted as part of the ongoing Pre-Feasibility Study ("PFS") for Diablillos.
Key takeaways from the PFS-level metallurgical test work include:
Recovery rates at the Oculto deposit are expected to range between 82% - 86% for silver and 84% - 89% for gold.These results represent a significant increase over the average recovery rates of 73.5% for silver and 86% for gold used in the 2022 Preliminary Economic Assessment (“PEA”).
A substantial percentage of the silver and gold at Oculto can be recovered by gravity separation which results in higher recovery rates and lower processing costs.
Importantly, fine grinding is not necessary with the most efficient recoveries achieved at a grind size of 150 microns for both gravity and cyanidation and an optimal retention time of 36 hours.
JAC and Fantasma Deposits
The Company reported positive preliminary metallurgical test results for the new JAC zone on June 01, 2023.
Key Highlights Include:
Overall recoveries at the JAC and Fantasma deposits range between 86% - 93% for silver and 82% - 91% for gold.
A substantial percentage of the silver at JAC can be recovered by gravity separation which increases overall recoveries.
Current testwork confirms that the same process flowsheet can be used to process mineralization from the Oculto, JAC and Fantasma deposits.
Milling tests have shown that 150 microns is the targeted grind size for the leaching of the mineralized material at a retention time of 36 hours.
Overall silver and gold recoveries could likely be increased further by grinding finer and with higher cyanide concentrations. Further metallurgical testwork and trade-off studies are now underway.
Favorable Recovery Rates
At the JAC and Fantasma deposits the silver minerals (chlorargyrite and iodargyrite) are easier to release by grinding, and are more sensitive to cyanide leaching as they occur in argillic alteration, whereas at Oculto they are mostly held more complexly in vuggy silica host rock.
Summary of Metallurgical Testwork Results for JAC and Fantasma Deposits
Target
Silver
Recoveries
Silver
Head Grades
Gold Recoveries
Gold
Head Grades
%
g/t
%
g/t
JAC & FANTASMA
86 - 93
142 - 172
82 - 91
0.11 - 0.17
Testwork on JAC and Fantasma samples showed that gravity separation before cyanide leaching recovers approximately 9% of the silver and 17% of the gold which, when combined with the subsequent cyanide leaching recoveries, results in total overall recoveries of between 86% and 93% for silver and between 82% and 91% for gold.
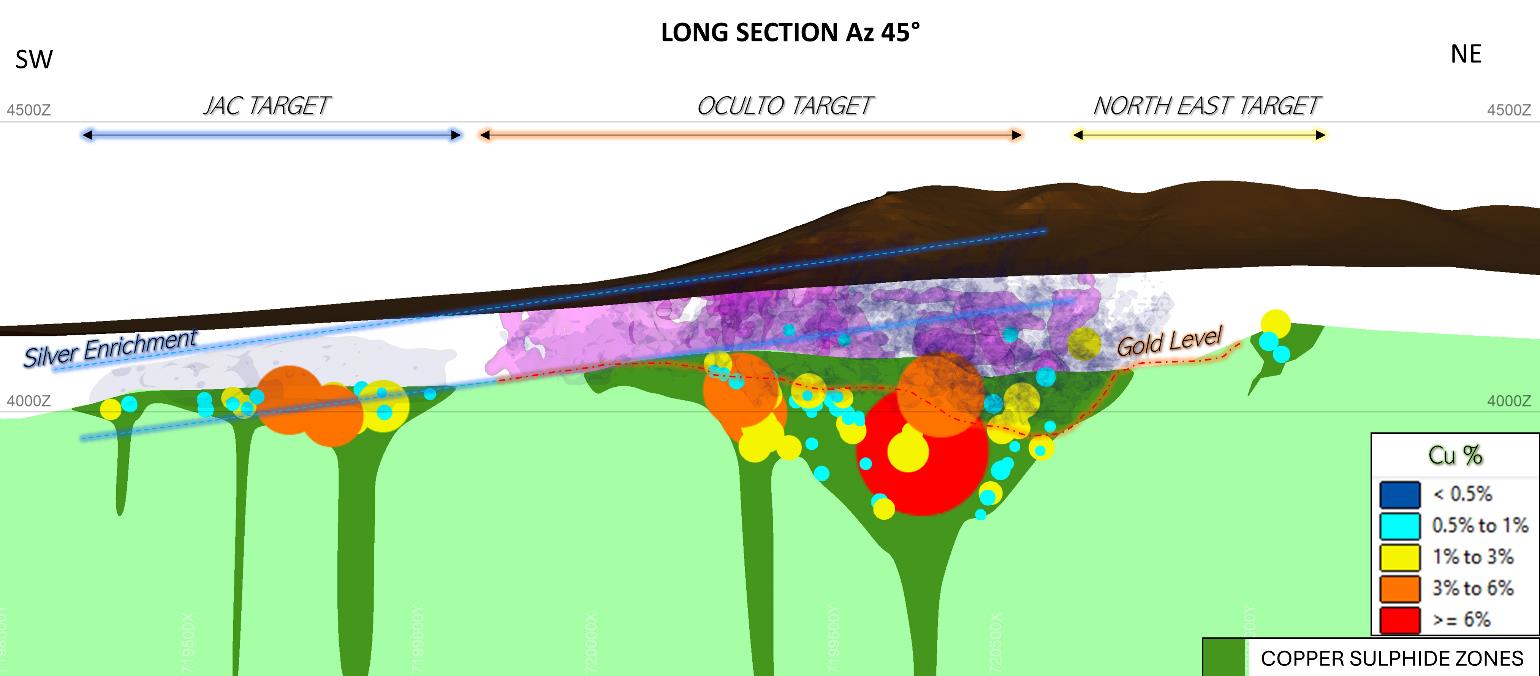
The Diablillos property hosts several zones of high-sulphidation epithermal alteration and mineralization with strong supergene overprinting. There are several known mineralized zones on the Diablillos property, with the Oculto zone hosting the principal silver-gold deposit. Oculto is strongly oxidized down to depths in the order of 300 m to 400 m from surface with oxide gold and silver mineralization overlying a pronounced copper sulphide zone extending beneath. The sulphide mineralization has an enriched copper layer with chalcocite coating chalcopyrite and pyrite, with associated variably high grades of gold and silver. Primary copper sulphide mineralisation extends to considerable depths towards the base of the mineralised system. The precious metal mineralization throughout the oxide zone of the deposit occurs as extremely fine grains along fractures and in breccias or coating the inside of vugs and weathered cavities. The dimensions of the optimised Whittle open pit shell measure 1,350 metres in length, 750 metres in width and extends to a maximum depth of approximately 300 metres.
Gold and silver mineralization ascended along steeply dipping feeder structures and was deposited in siliceous breccia zones. Mineralizing fluids also migrated laterally along shallowly dipping favorable permeability horizons where it was deposited along with silicification. Gold is associated with a deeper permeability horizon and with shallow zones associated with the feeder structures, while there is a secondary enriched silver zone related to a weathered horizon.
Diablillos Geological Model: Near-Surface Epithermal Ag-Au Deposit, With Cu-Au Porphyry Intrusive at Depth
The Table below highlights reported drill intercepts in sulphide mineralization, from the limited amount of deeper drilling conducted at Diablillos to date.
Highlights of Selected High-Grade Intercepts in Sulphide Minerlization at Diablillos
Drill Hole
From
(m)
To
(m)
Interval
(m)
Cu
(%)
Au
(g/t)
Ag (g/t)
DDH-19-002
369
401
32
1.26
2.20
24.6
DDH-19-002
438
446
8
2.11
0.47
32.7
DDH-20-001
268
271
3
1.06
3.45
339.1
DDH-20-001
275
303
28
3.25
1.60
358.3
DDH-20-002
337
349
12
1.74
1.14
12.3
DDH-20-003
446
446.5
0.5
6.37
0.56
12.3
DDH-20-006A
293
315.5
22.5
0.52
0.35
9.45
DDH-20-007
265
270
5
1.54
0.03
98.5
DDH-20-007
376
377
1
1.22
2.34
51.6
DDH-20-008
350
361
11
1.58
1.27
12.7
DDH-20-010A
313.5
320.5
7
0.99
2.18
17.8
DDH-20-019
146
173
27
1.37
0.20
31.0
DDH-21-009
311
316
5
0.90
2.14
10.3
DDH-21-009
354
356
2
0.66
1.73
37.7
DDH-21-020
302.5
324
21.5
1.76
-
-
DDH-21-024
275
287
12
1.40
2.98
26.8
DDH-21-040
272
277
5
4.20
3.22
49.5
DDH-22-021
368.5
379.5
11
2.00
0.30
5.49
DDH-22-043
215
227
12
3.63
0.29
3,664.9
DDH-22-067
185
195
10
2.55
0.73
590.3
DDH-22-067
197
206
9
0.75
1.25
534.4
DDH-22-078
181
198.5
17.5
1.54
0.01
25.5
DDH-22-083
162.5
171
8.5
3.36
0.10
694.7
DDH-22-086
158
172
14
1.18
-
-
DDH-23-009
169.5
183
13.5
0.64
0.06
184.9
DDH-23-025
179
212.5
33.5
3.03
0.01
88.5
DDH-23-046
157
160
3
1.11
0.27
2,070.0
DDH-23-062
155
163
8
1.04
0.01
60.7
Note: All results are rounded. Assays are uncut and undiluted. Widths are drilled widths, not true widths. True widths are estimated to be approximately 80% of the interval widths.
Over US$50 million has been spent on exploration at Diablillos totaling over 100,000 meters of drilling in over 450 holes.
Year
Operator
Description
1983
Secretaría de Minería de la Nación
1,409 rock chip samples (includes 190 outcrop and 271 slope debris samples from Diablillos Sur)
1984 - 1987
Shell C.A.R.S
A Rock geochemical survey; three Winkie drill holes
1987
Ophir Partnership
37 rotary drill holes (approximately 30 m deep) in the Corderos, Pedernales, Laderas, and Jasperoide areas
1989 - 1991
BHP
Geological mapping (1:1,000 to 1:7,500 scale); 380 rock chip samples; 1,200 m of bulldozer trenches; 55 air RC holes (6,833 m)
1993
Pacific Rim Mining Corporation
Five diamond drill holes (1,001.8 m) in the Oculto Zone
1994
Pacific Rim Mining Corporation
148 km of chain and compass grid; geological mapping; 122 line-km of ground magnetic survey; 34 line-km of induced polarization (IP) survey; 213 hand auger samples; 2.5 km of trenching; 250+ rock chip samples; 12 diamond drill holes (2,013.9 m)
1996 - 1997
Barrick Gold Corp
Geological mapping; surface sampling; RC drilling; CSAMT survey; mag survey; environmental impact study; metallurgical test work
2003
Pacific Rim Mining Corporation
(for Silver Standard)
20 diamond drill holes (3,046 m)
2005
Pacific Rim Mining Corporation
(for Silver Standard)
Five diamond drill holes each at Renacuajo and Alpaca
2007
Pacific Rim Mining Corporation
(for Silver Standard)
45 diamond drill holes (9,600 m) on Oculto; one hole (203 m) at Laderos; three holes (unknown length) at Pedernales; five holes (unknown length) at Los Corderos; four HQ-size diamond drill holes sampled for metallurgical tests
2008
Pacific Rim Mining Corporation
(for Silver Standard)
52 diamond drill holes (7,910 m), three of these for geotechnical studies; additional metallurgical studies
2009
Silver Standard Resources
Mineral Resource estimate
2011 - 2012
Silver Standard Resources
Internal Preliminary Economic Assessment, rock chip sampling, 1,679 m diamond drilling (19 holes)
2017
AbraSilver
28 drillholes and a total of 3,148.5m
2018
AbraSilver
Preliminary Economic Asessment including Resource estimate
2019
AbraSilver
Phase I Drilling Campaign with 2 diamond drill holes (844 m),
2020 - 2021
AbraSilver
Phase II Drilling Campaign of 55 drillholes and a total of 15,143 m expanding Oculto to North, West and East and testing new targets
2022 - 2023
AbraSilver
Phase III Drilling Campaign completed totalling over 24,000 m, resulting in the discovery of the new high-grade JAC deposit for which a maiden resource was announced in November 2023
2024
AbraSilver
In May 2024, the Company commenced the fully-funded Phase IV exploration campaign which consists of three diamond drill rigs, drilling a total of 20,000 m, and is expected to be completed by Q1/2025
Subscribe to our Newsletter
I agree to and consent to receive news, updates, and other communications by way of commercial electronic messages (including email) from AbraSilver Resource Corp.
I understand I may withdraw consent at any time by clicking the unsubscribe link contained in all emails from AbraSilver Resource Corp.
AbraSilver Resource Corp
220 Bay St, Suite 550
Toronto, ON M5J 2W4 [email protected]